- Set up a sampling grid using the 'Grid' tool within a Sampling entry.
Setting up Sampling Grid
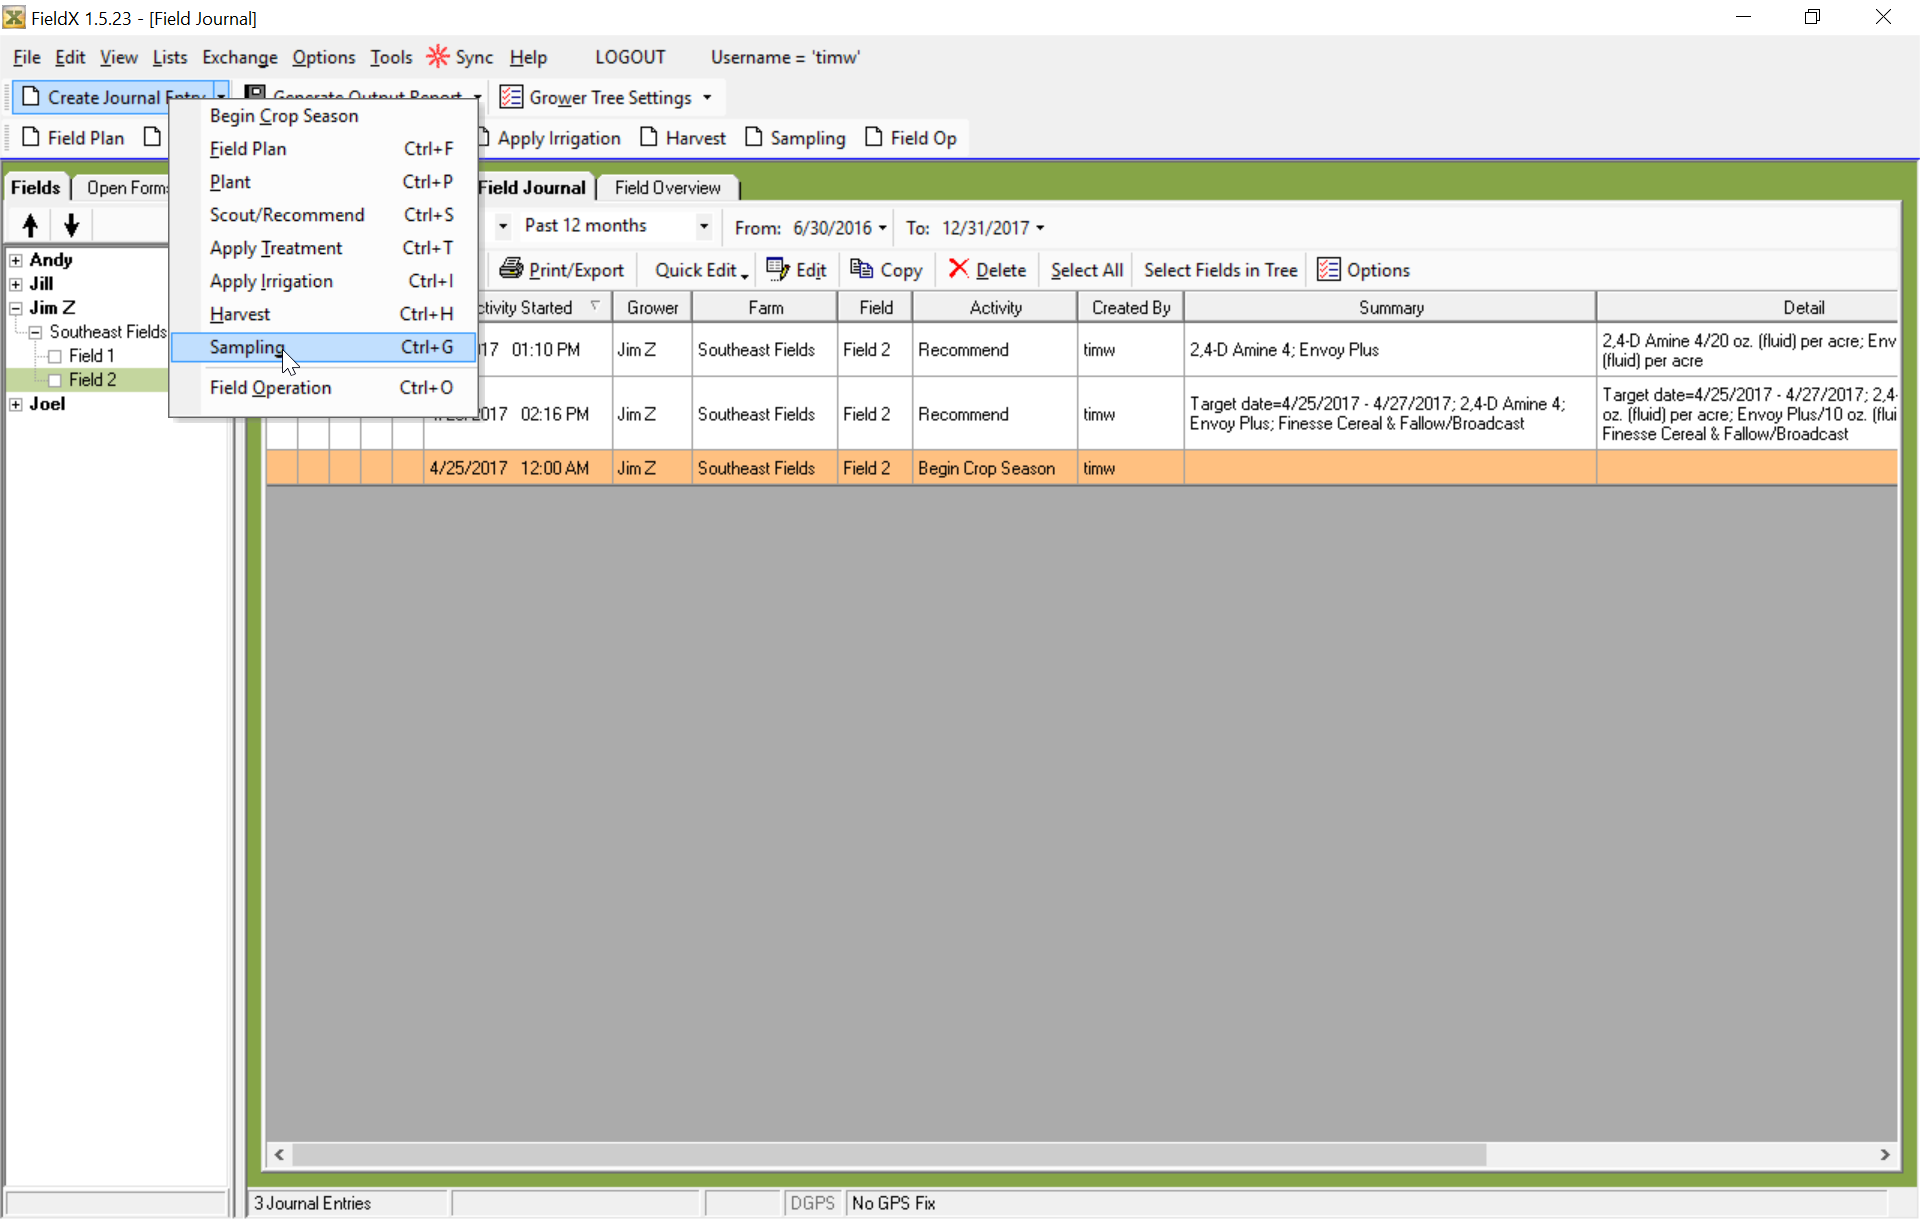
- Select a field from your Grower Tree.
- Click ‘Create Journal Entry’, then ‘Sampling.’ A journal entry form will open.
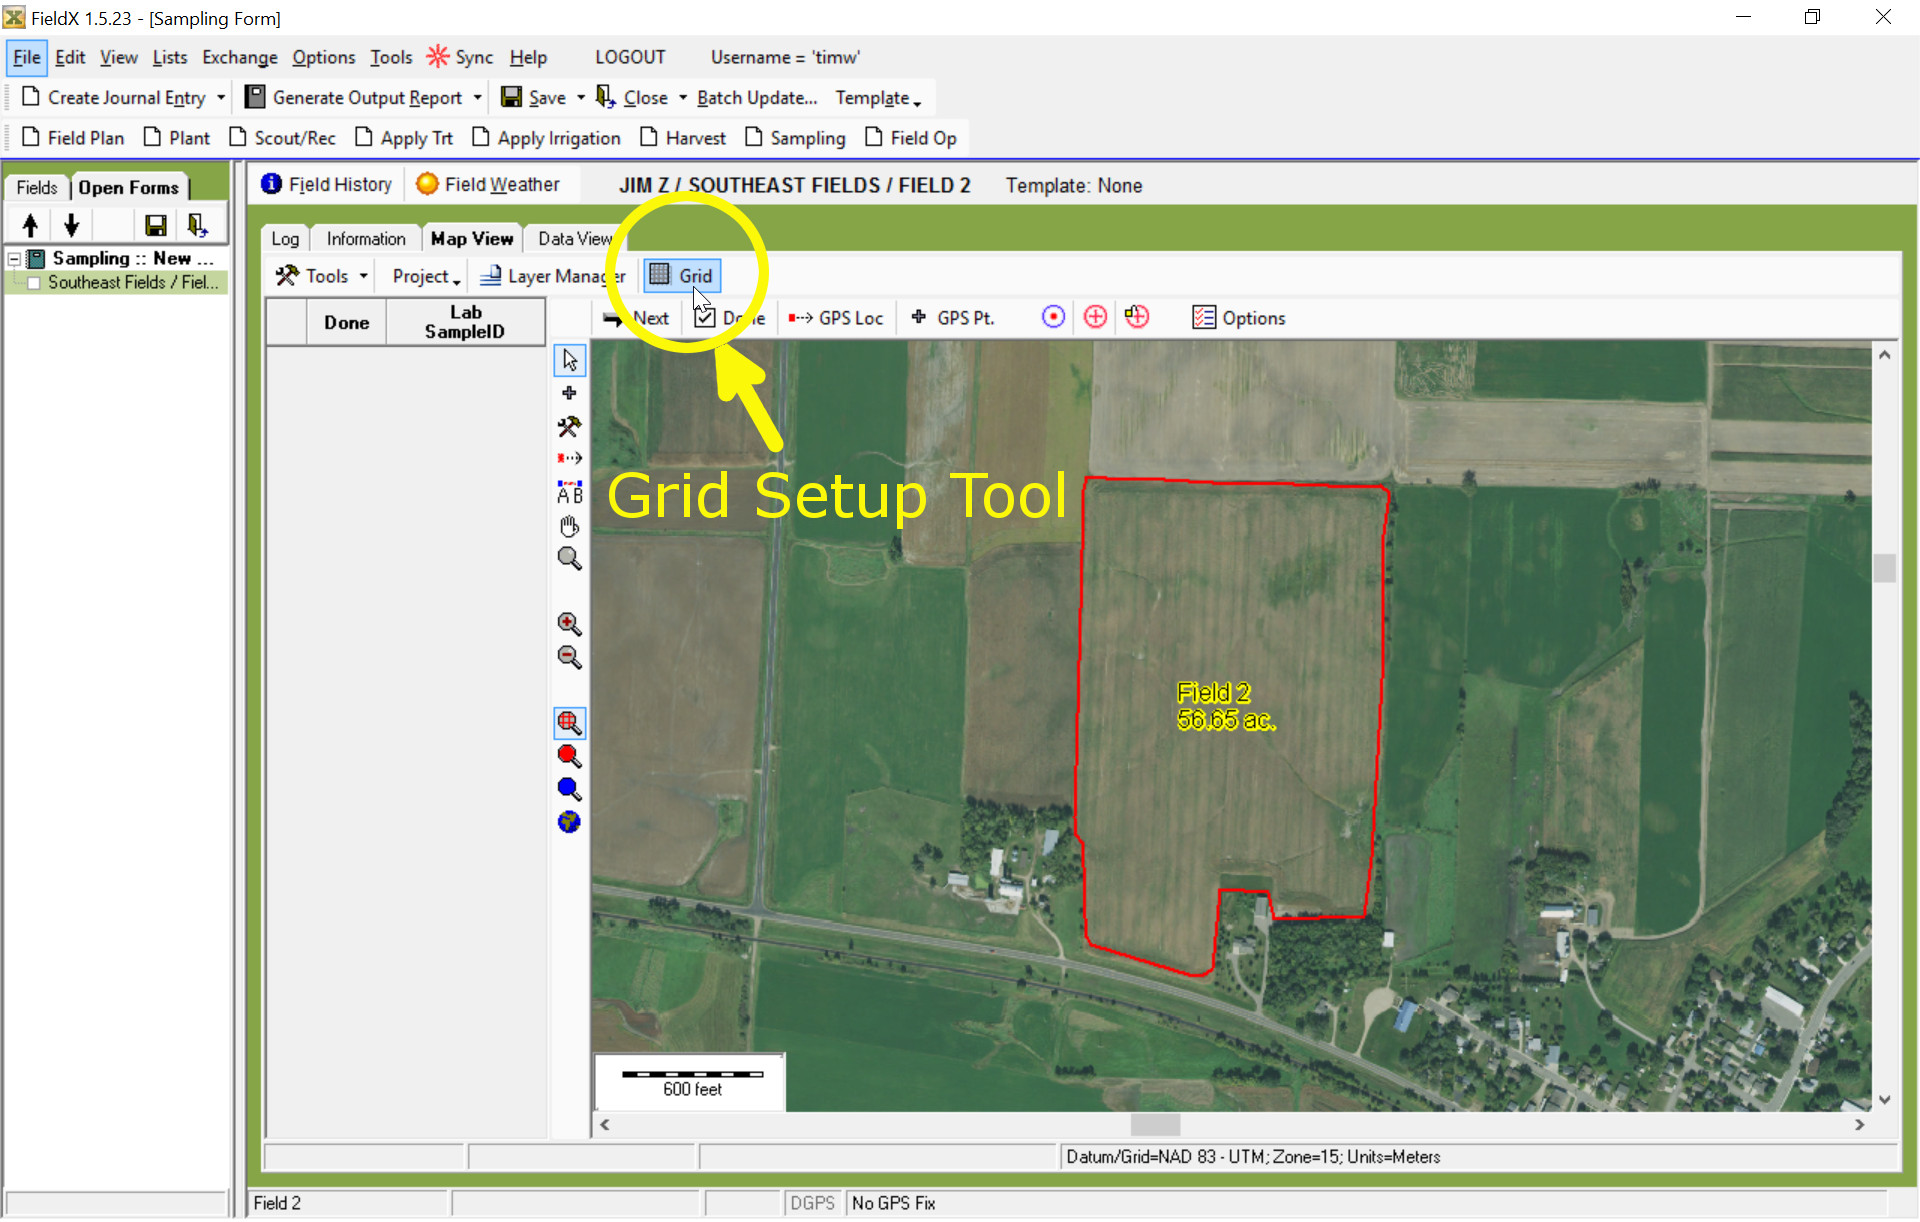
- Next, click on the ‘Map View.’ The program displays the Field Border on the map.
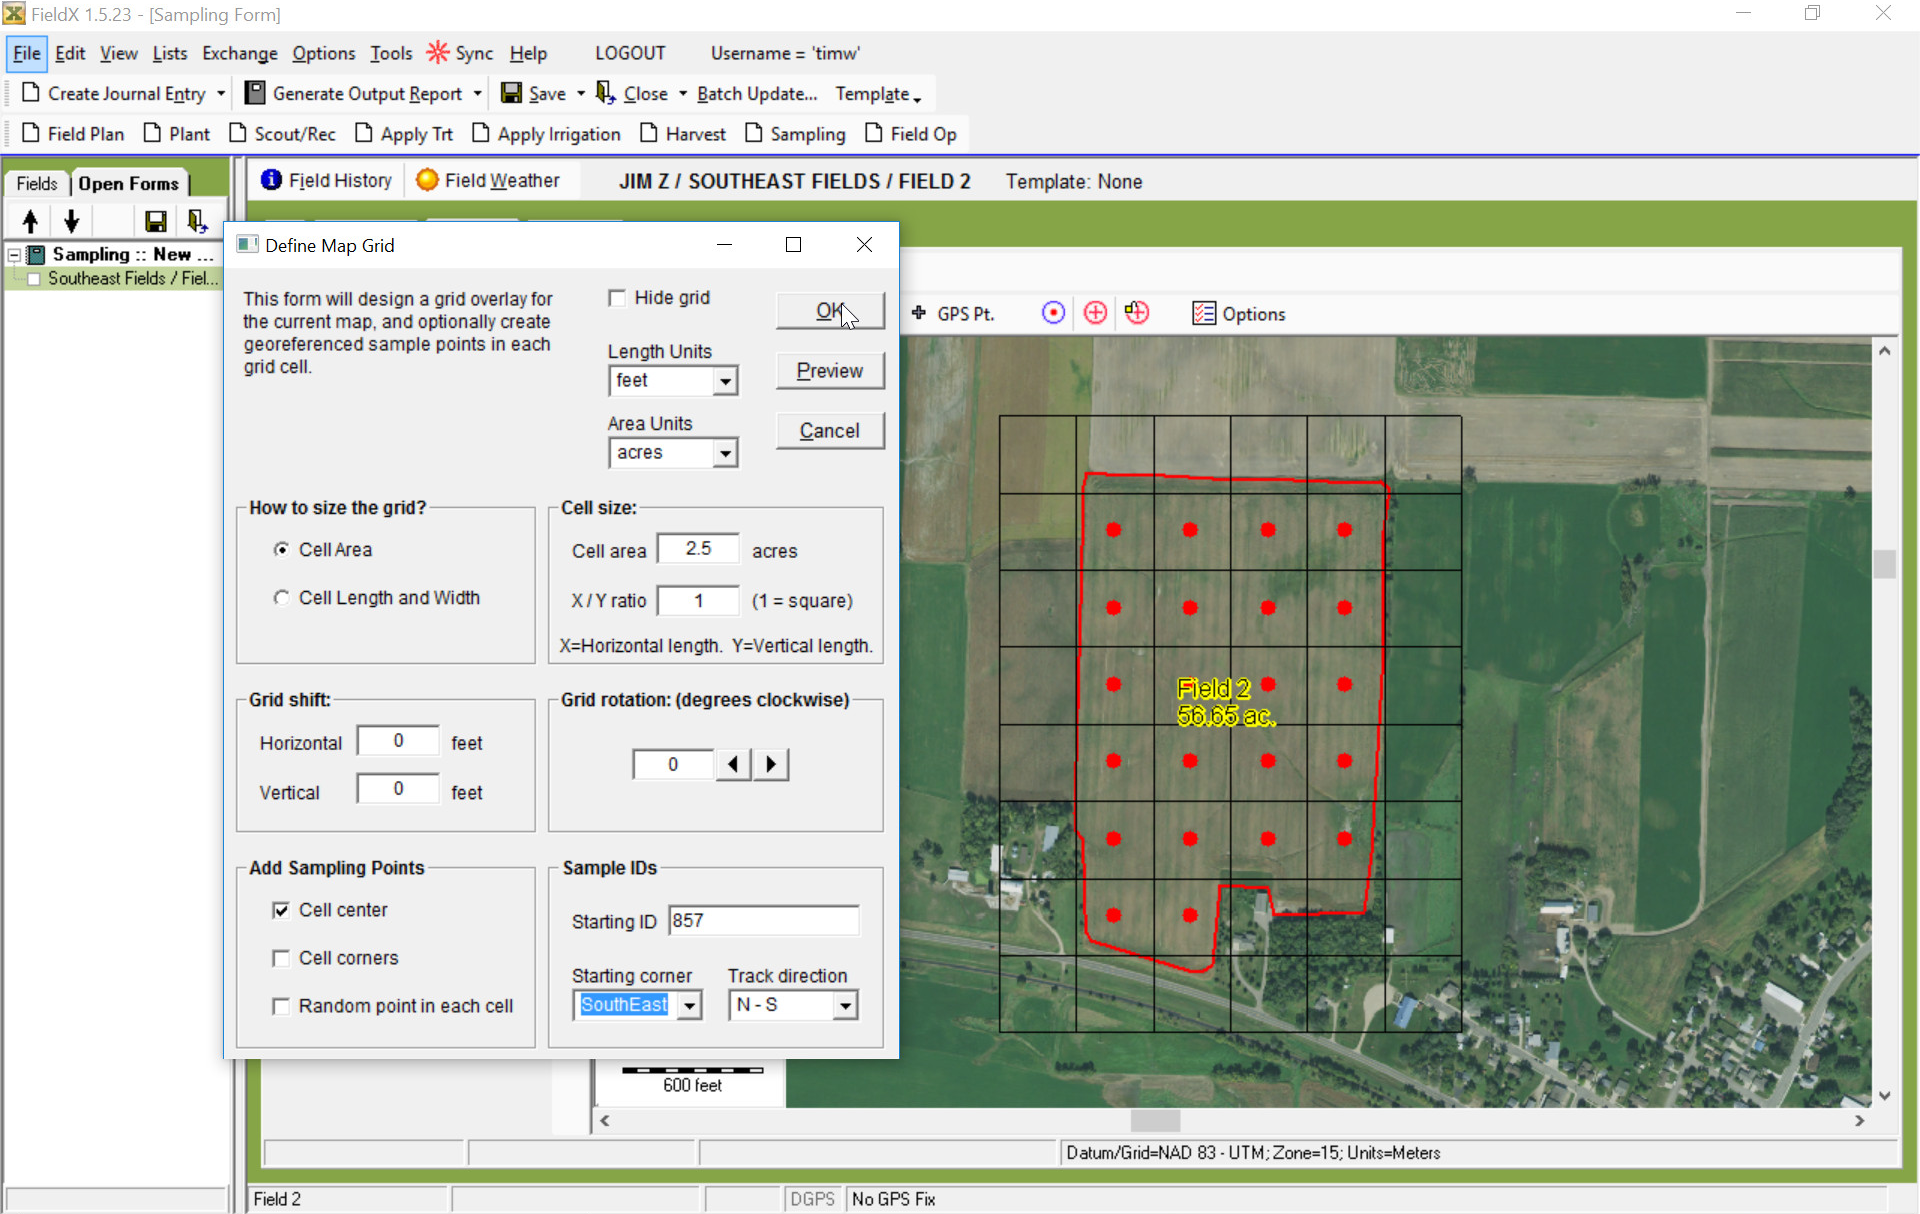
- Click on the ‘Grid’ tool to set the parameters for your Sampling grid. Note that you can click ‘Preview’ to see the grid overlaid on the map at any time.
- First, confirm the units you will be using for the Length units and Area Units.
- Next, select ‘How to Size the Grid,’ which can be by the Cell Area, or by the Cell Length and Width.
- Then define the Cell Size. If Cell Area is selected, identify the Area and then the X/Y Ratio if you prefer that the cell is a rectangle instead of a square. Hit ‘Preview’ to check the fit of the grid on the field.
- If the grid doesn’t fit appropriately, use the Grid Shift and Rotation to specify how the grid should be adjusted. Alternatively, use an ‘AB’ line after saving the sampling grid.
- Then move to the ‘Add Sampling Points’ section to specify the location of the sample point within an individual grid.
- Finally, select the starting Sample ID and Starting Corner. The program will add names and numbers to the points automatically. Note that the Sample ID must finish with a numeric digit.
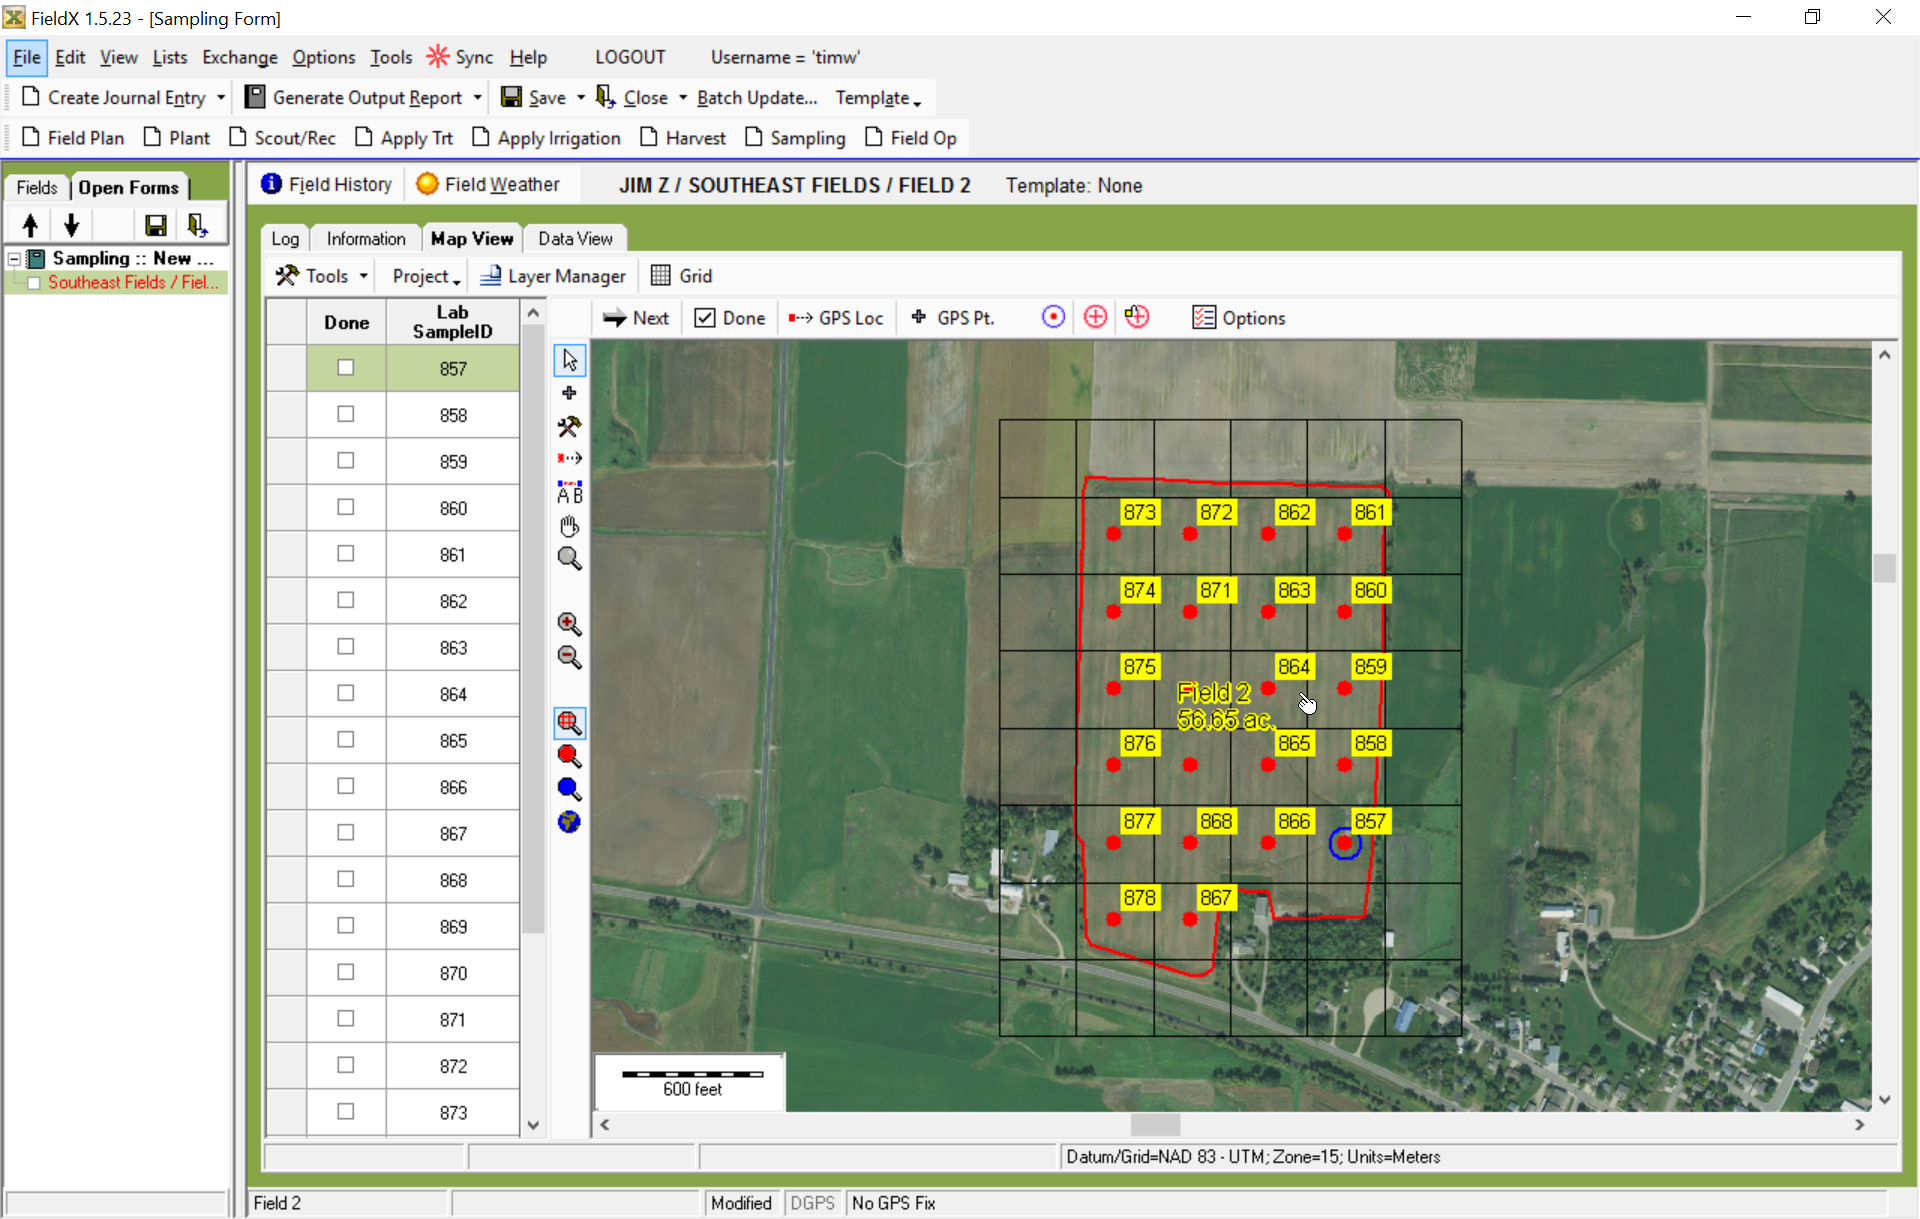
- When finished, click ‘OK’ and review the points.
The entry is now ready to navigate to the sample points, or you can make further edits to the points with FieldX Office for the PC, FieldX Sampling app for the iPad or iPhone, or PocketRecon for FieldX for the PocketPC.
Saving and Syncing the Sampling Entry
Once the grid is created, saving the journal entry backs up the data and create a record of the sampling event for future reference.
- Click ‘Save’ and ‘Close’ to leave the journal entry.
- Then click ‘Sync’ to send the journal entry to the server.
After completing the sync, the field and journal entry will display on the Sampling app the next time the user refreshes the app.
Additional Information:
- The ‘Log’ tab is used to enter in general information on the Sampling event, such as the Date and General Comments.
- The ‘Information’ tab is used to enter information specific to the Sampling event, such as Sampling Depth.
- The ‘Map View’ displays the field map and points, and can be used to set up, edit, and navigate to sampling points.


