Set Field Border Colors
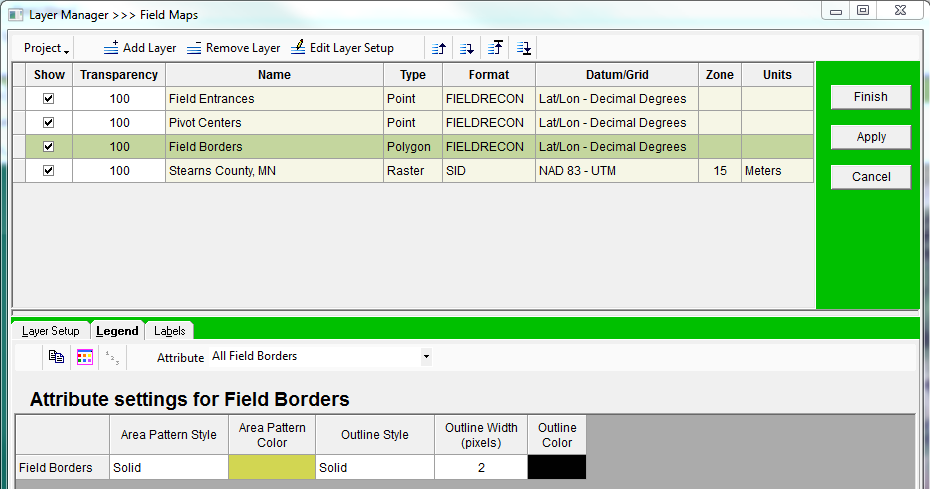
- Click on the ‘Field Maps’ tab.
- Open ‘General Tools’, then ‘Layer Manager’.
- Select Field Borders.
- Click on the ‘Legend’ tab.
- Select the ‘Attribute’ to set colors based on.
- Select the ‘Area Pattern’ from the dropdown menu. This includes a range of options from transparent, to solid, with a variety of line patterns as options as well.
- Select the ‘Area Color’ by first clicking on the ‘…’ button, and then selecting a color from the palette that opens. Press ‘OK’ when finished selecting a color.
- If the color you want is not available in the window, a new color can be added using the Hugh Lat Sum scores or the Red Green Blue (RGB) scores on the lower- right.
- These are saved for future selection in the Custom Colors palette below the main grid of colors.
- Select an ‘Outline Style’ from the drop-down menu, which includes combinations of solid lines, dashed, lines, and dotted lines.
- Select the ‘Outline Width’ in pixels by double clicking on the cell then typing a new number in. A higher number for the width indicates a thicker line.
- Select an ‘Outline Color’ by following the same instructions as the ‘Area Color.’
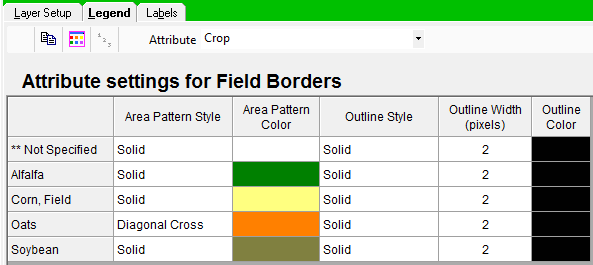
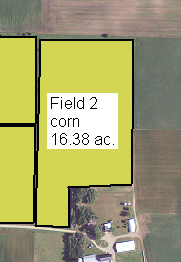
For Example: Set Colors for Variety or Crop Technology
You could set the interior of a field border to indicate the crop by manually selecting the same color and pattern style for the crop, then select an outline color to correspond to a variety’s crop technology. This can be done in the user’s preferred method to indicate the desired information.
**Note that this setting does not sync between installations of FieldX Office, and would need to be set up on each computer in an account.
Set Field Border Labels
The Labels Tab shows a variety of options for the labels related to Field Borders, Pivot Centers, and Field Entrances.
- Click on the ‘Field Maps’ tab.
- Open ‘General Tools’, then ‘Layer Manager’.
- Select Field Borders.
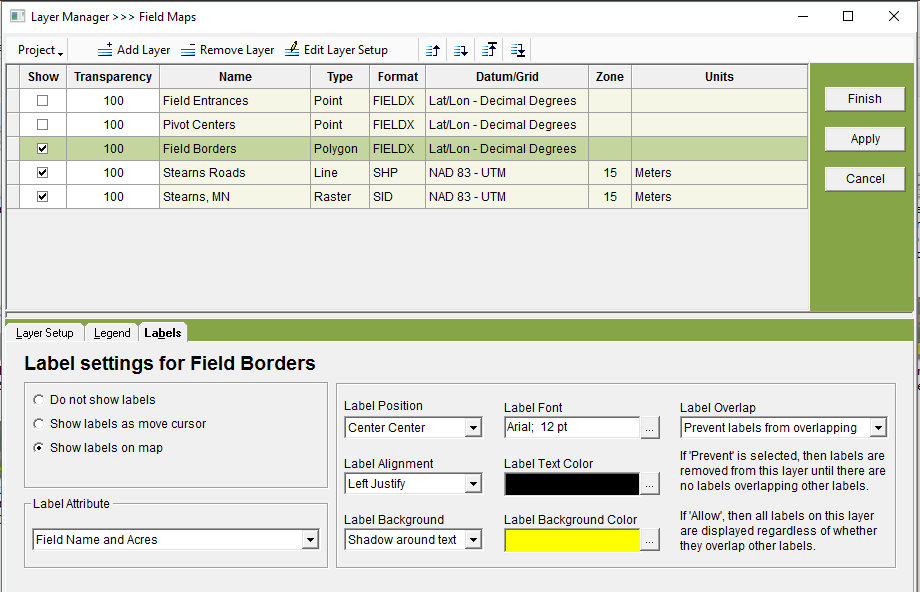
- First, select when and if the label should be shown by selecting an option in top-left of the lower section.
- ‘Do not show labels’ hides the labels completely.
- ‘Show labels as move cursor’ shows the labels anytime the cursor is hovering over a field or a point.
- ‘Show labels on map’ keeps the label displayed at all times.
- Select the type of information that should be displayed in the ‘Label Attribute’ drop-down menu located in the lower-left of the program.
- The information for the labels are derived from the Attributes tab for a field and the most recent journal entries with the specified information. For example, data from the most recent Planting journal entry will be used if Crop is among the attributes displayed in the label.
- Specify the positioning and display of the label with the first column of drop-down menus for Label Position and Label Alignment.
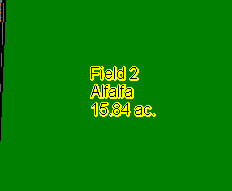
- Specify the label background properties. The drop down menus for Label Background Color and Label Background specify how the label background is set up. The screenshots on this page or linked here show an example of this setup.
- Specify the Font and Color of the text with the drop-down menus.
- Select an option in ‘Prevent labels from overlapping’
- By preventing the labels from overlapping, the labels are hidden when the zoom level is such that labels overlap each other.
- If ‘Allow…’ is chosen, then the labels will be shown regardless of whether they overlap.


