FieldX News
FieldX Tips: Improving your Map Display in FieldX Office
In today’s tip, we are focusing on some basic setup for the Field Maps tab in FieldX Office.
Map Settings
Color Fields by Crop or Variety
- How this helps you:
- When you set a color for each crop or variety, you can quickly see what crops are planted in your fields by glancing at your map. Consultants often print the maps of fields colored by crops for their customers using the ‘Print’ function.
- Click here for instructions on coloring field borders by crop.
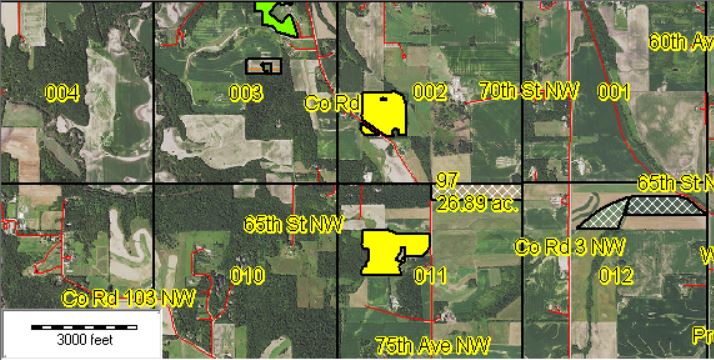
- Example of Field Borders colored by crop:
Data Viewer
- How this helps you:
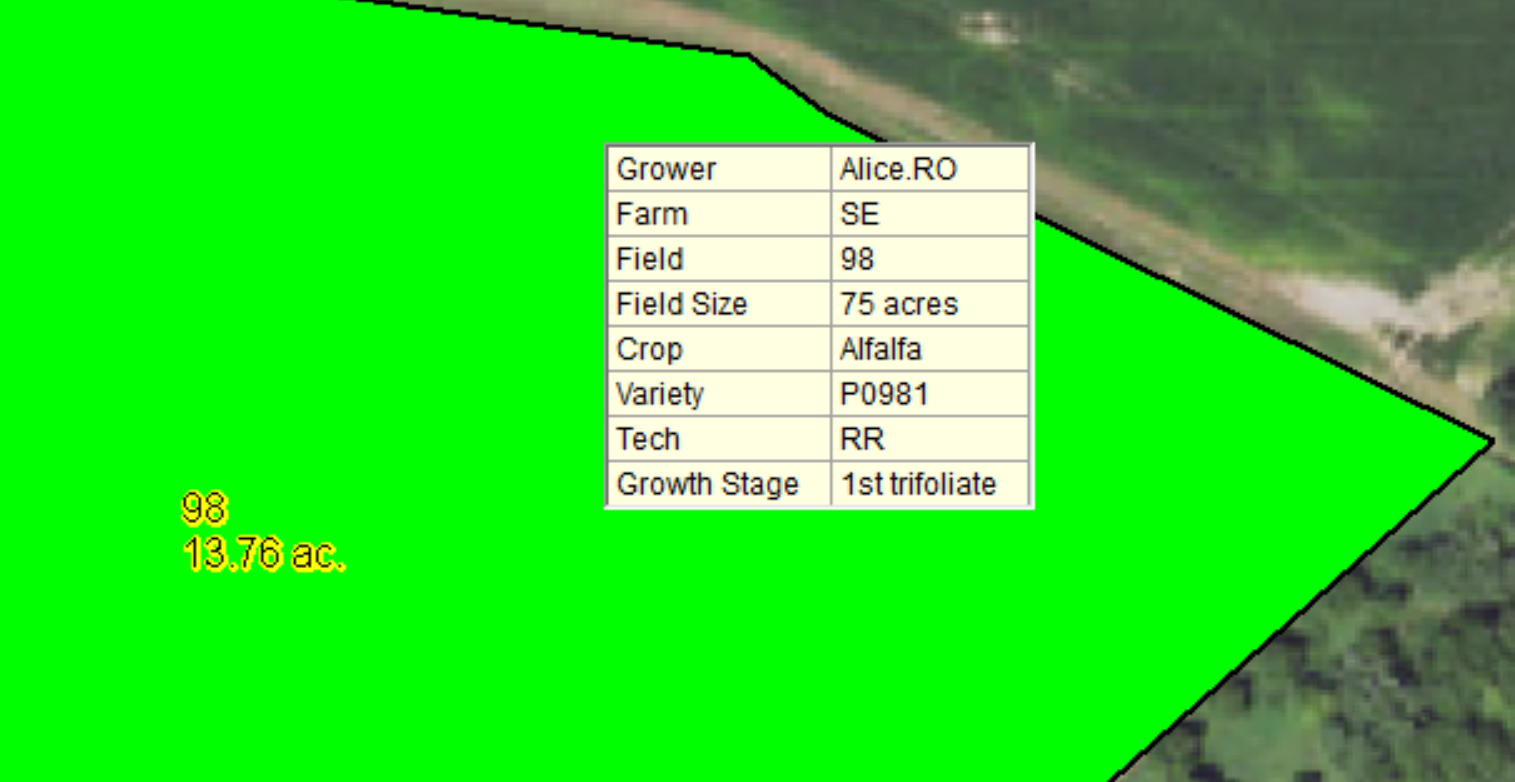
- The ‘Data Viewer’ tool allows the user to see relevant data when hovering their mouse over a field border. This will enable the user to quickly scan their map and dig into summary data for an individual field without checking the Field Journal tab.
- For example, you can see the crop, variety, most recent growth stage, and a number of milestone dates without having to open the Field Journal tab or do an output report.
- Here are the steps to turn on the ‘Data Viewer’
- Click on the Field Maps tab.
- Click on ‘General Tools’, then click on the ‘Data Viewer’ button.
- In the window that opens, select ‘Show the Data Viewer.’
- Then checkmark the data that you want to display.
- Click ‘OK’
- Then just hover your mouse over a field border to view the data.
- Example field with Data Viewer turned on:
Background Maps
Add New USDA NAIP Aerial Image Layers
- How this helps you:
- With USDA NAIP imagery, you can see an image of the fields while you are on the Maps tab. These images are updated every few years, and all the states in the US have been updated in either 2018 or 2019.
- Click here for instructions on adding NAIP Background Imagery.
Add Roads, Section, and Township Layer
- How this helps you:
- Including the Roads, Section, and Township layers in the Field Maps tab can be useful to help a user find fields on the map, and when printing maps.
- Click here for instructions on adding Roads, Section, and Township Layers.